There is big controversy going around that technical analysis doesn't work on NEPSE so here I did some back testing on NEPSE index before that let's see what is technical analysis and its accuracy in the market.
What is Technical Analysis?
Basically, Technical analysis refers to the analysis of stock market using different chart patterns, volume and indicators. There are generally three assumptions:
1) Market discounts everything
2) Price moves in a trend
3) History trends to repeat itself
Is technical analysis 100% accurate?
No, technical analysis is not 100% accurate. Not even fundamental analysis is 100% accurate. No one can predict the market 100%. Almost around 70% accuracy of technical analysis is expected.
Back testing of NEPSE index
This testing was done surfacy in NEPSE index and this does not mean that every chart patterns here gives 100% result. Most of the time chart patterns do fail and stop loss is hit but if you are able manage your risk to reward ratio there is always a win win situation in the market. There are few charts pattern I picked up from NEPSE index:
Here expectation refers to the example from the web and reality refers to how beautifully NEPSE index follows technical analysis chart pattern.
1) Symmetrical Triangle pattern
Expectation

Reality

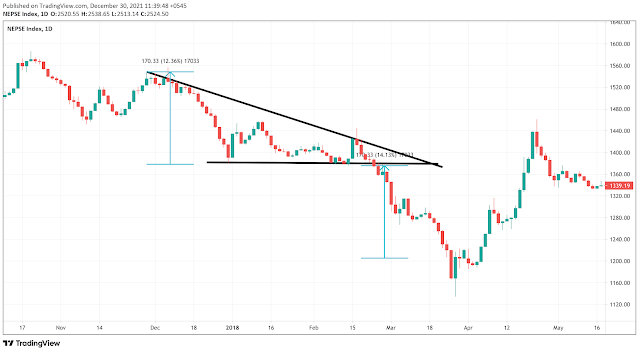
2)Descending Triangle pattern
Expectation

Reality
3) Head and Shoulder
Expectation

Reality

4) M pattern
Expectation

Reality

5) W pattern
Expectation

Reality

6) Rounding Bottom pattern
Expectation


