The recent weekly scenario has been characterized by a trading range between 1806.95 and 2224.48. This range-bound market suggests that the market has been moving within a specific price range without a clear trend in either direction. For market participants, making informed decisions in such a scenario typically requires identifying potential breakout points. One interesting technical indicator that has emerged is the "hammer" candlestick pattern, particularly in the context of the weekly timeframe. The significance of this pattern increases with higher timeframes, as it suggests stronger potential reversal signals.
The hammer candlestick pattern itself is recognized as a potential reversal signal in technical analysis. It is characterized by a small-bodied candle with a long lower shadow, resembling a hammer. This pattern often indicates a shift from a downtrend to a potential uptrend, suggesting a potential bullish reversal. Given the higher timeframe, the hammer pattern becomes more reliable as it reflects a longer accumulation of market sentiment and information.
One crucial aspect that traders and investors often consider is the risk-to-reward ratio when making trading decisions. In this case, the risk-to-reward ratio stands at an appealing 1:2.41, indicating that the potential reward is more than double the potential risk. This is generally considered a favorable risk-to-reward ratio, as it implies that the potential gain outweighs the potential loss.
Taking all these factors into consideration, a potential trading strategy could be to buy at the current market price, with a well-defined stop loss set just below the hammer pattern. This stop loss serves as a safety net in case the market does not follow the anticipated bullish reversal, limiting potential losses. The target price for this trade could be set at 2244.48, which aligns with the upper boundary of the recent trading range. This approach combines the potential bullish indication from the hammer candlestick pattern, the higher timeframe reliability, and the attractive risk-to-reward ratio.
However, it's important to note that all trading decisions carry inherent risks. Market conditions can change rapidly, and unforeseen events can impact stock prices. Traders and investors should conduct thorough research, consider their risk tolerance, and potentially consult with financial professionals before executing any trades.
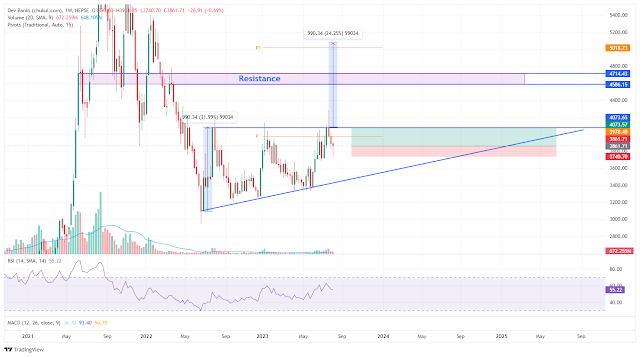
Development Bank weekly scenario.
A notable technical scenario has emerged on the weekly timeframe. An ascending triangle pattern is forming, and as is often the case, its significance tends to increase with higher timeframes. This pattern, marked by higher lows and a consistent resistance level, suggests the potential for an upward price movement. Adding to this is the appearance of a "hammer" candlestick pattern on the same weekly timeframe.
Traders have two strategic options in the current situation. One is to engage in the market now, following the hammer candlestick pattern’s potential reversal signal. With a risk-to-reward ratio of 1:1.75, a trade can be executed with a stop loss below the hammer and a target price of 4073.57.
The alternative approach is to wait for confirmation through the breakout of the ascending triangle pattern. Traders could also consider entering near the triangle's trend line, enhancing the trade's likelihood of success.
Finance weekly Scenario.
Adding to this, the observation of a "hammer"
candlestick pattern on the same weekly timeframe elevates the intrigue.
Traders have a strategic option at hand: buying at the
present market price, with a stop loss strategically positioned below the
hammer candlestick pattern. The target range spans from 1956.41 to 1989.99,
offering a clear goal for potential profits.
Notably, the risk-to-reward ratio stands at an attractive
1:2.55, implying the potential reward substantially outweighs the risk.
Hydropower weekly scenario.
A "hammer" candlestick pattern has emerged within
a minor support area, hinting at a potential bullish reversal.
For traders seeking strategic opportunities, buying at the
current market price is an option, with a stop loss placed below the hammer pattern.
This mitigates risk while aiming for a target around 2551.46, promising an
attractive potential gain.
The risk-to-reward ratio is notably favorable at 1:3.24,
indicating that potential rewards significantly outweigh potential risks.
Life Insurance weekly scenario.
A distinctive "hammer" candlestick pattern has
emerged within a minor support area, suggesting the potential for a bullish
reversal.
For traders considering strategic moves, the current
scenario presents an opportunity. The approach involves buying at the current
market price, accompanied by a well-placed stop loss just below the hammer
candlestick pattern. This serves as a precaution against potential losses if
market conditions deviate from the anticipated trend. The target price for this
trade is set around 12509.75, offering an attractive potential for profit.
The risk-to-reward ratio in this situation stands at a favorable 1:2.54, implying that potential rewards surpass potential risks – a prudent consideration in trading decisions.
However, it's vital to acknowledge the inherent
uncertainties of trading. Rapid market shifts and external influences on stock
prices must be considered. Thorough research, self-assessment of risk
tolerance, and possibly seeking expert advice are prudent steps before executing
trades. Whether seizing current dynamics or awaiting further confirmation, a
balanced and informed approach remains key in successful stock trading.


