Thursday, December 14, 2023

Navigating Market Crossroads: Understanding the Classic Doji on Nepse and What It Means Near Resistance

What is a Doji Candlestick?

The Doji candlestick is a significant aspect of technical analysis, revealing market indecision and signaling potential trend reversals. It materializes when an asset's opening and closing prices are nearly identical, forming a minimal or non-existent body with extended upper and lower wicks indicating price volatility.

Key Doji types include the classic, dragonfly, gravestone, and long-legged variations. Classic Dojis signify market equilibrium, while dragonfly and gravestone Dojis suggest potential bullish and bearish reversals, respectively. Long-legged Dojis reflect heightened indecision due to extensive price movement.

Interpreting Doji patterns involves recognizing market indecision and potential reversals, but it's essential to confirm signals with additional technical indicators and consider trading volume. Doji patterns alone may produce false signals, emphasizing the need for a comprehensive analysis and awareness of market context.

Despite their usefulness, Doji patterns are not infallible, and traders should exercise caution, understanding their limitations and verifying signals with other tools for more reliable decision-making.


Doji On Nepse 

A classic Doji has formed on the Nepse chart, it still holds significant implications, particularly in the context of being within a supply zone or resistance level. Here's an elaboration:

The presence of a classic Doji on the Nepse chart signifies market indecision, where the opening and closing prices are essentially equal, forming a thin horizontal line. This indecision suggests a temporary equilibrium between buyers and sellers. However, when this Doji pattern occurs within a supply zone or resistance level, its significance is heightened.


Classic Doji within a Supply Zone/Resistance:

  • Market Indecision at Resistance:

    • The classic Doji within a supply zone indicates that, despite reaching a resistance level, the market is undecided about its next move. This could be a pivotal moment where buyers and sellers are closely balanced.

  • Potential Trend Reversal or Continuation:

    • The classic Doji at a resistance level can be interpreted as a potential signal for a trend reversal. If the Doji is followed by a subsequent price decline, it could suggest that the bears are gaining control. On the other hand, if it is followed by a breakout above the resistance, it might signal a continuation of the existing uptrend.

  • Confirmation and Volume Analysis:

    • Traders should seek confirmation from other technical indicators or price action signals. Analyzing trading volume during the formation of the Doji can provide insights into the strength of the potential reversal or continuation.

  • Risk Management:

    • Given the uncertainty associated with market indecision, traders should implement effective risk management strategies. This includes setting stop-loss orders to limit potential losses and being prepared for different scenarios.

In summary, a classic Doji within a supply zone or resistance level on the Nepse chart suggests a critical juncture in the market. It's a moment where participants are evaluating their positions, and the subsequent price action will likely provide valuable insights into the future trend direction. Careful analysis, confirmation from other indicators, and prudent risk management are essential when considering trading decisions in such scenarios.


Wednesday, November 29, 2023

Quick Guide to Munger's Investment Rules


Charles T. Munger, widely known as Charlie Munger, was an American investor, businessperson, and philanthropist born on January 1, 1924. He was famous for being the Vice Chairman of Berkshire Hathaway, a big company led by Warren Buffett. Munger played a crucial role in Berkshire Hathaway's success, working closely with Buffett for many years.

Growing up in Omaha, Nebraska, Munger studied mathematics at the University of Michigan. Later, he attended Harvard Law School, earning his law degree in 1948. After practicing law for a while, he moved into the investment business.

In 1965, Munger joined forces with Warren Buffett, forming a highly successful and long-lasting partnership in finance. Munger was known for his sharp mind, wit, and ability to look at businesses from different angles. He was respected in the financial community and often sought after for his insights into investing and business.

Charlie Munger was not just about business; he valued learning throughout life and believed in looking at problems from different perspectives. He shared his knowledge through talks, interviews, and writings, not just in finance but also in other areas. Munger also made significant contributions to various charitable causes.

Let's delve into Munger's investing principles:

  1. Lifelong Learning:

  • Munger strongly encouraged continuous learning. He believed it was essential to understand various subjects beyond just finance to make better decisions.

  1. Circle of Competence:

  • Munger advised investors to stick to what they knew well. He recommended avoiding making investment decisions in areas they didn't understand.

  1. Inversion:

  • Munger liked to think backward. Instead of just thinking about success, he suggested considering how to avoid failure. This helped in spotting potential problems.

  1. Long-Term Perspective:

  • Munger, along with Buffett, believed in a long-term approach to investing. They liked businesses with strong advantages that could last and didn't get swayed by short-term market changes.

  1. Patience and Discipline:

  • According to Munger, successful investing required patience. He advised not rushing, waiting for the right opportunities, and not getting influenced by short-term market ups and downs.

  1. Avoiding Cognitive Biases:

  • Munger understood how our minds could trick us. He advised being aware of biases like being too optimistic or overconfident and making decisions based on clear thinking.

  1. Ethical Considerations:

  • Munger placed a high value on ethics in business and investing. He suggested investing in companies with strong ethical values and trustworthy leadership.

  1. Preparation and Hard Work:

  • Munger attributed his success to being well-prepared and working hard. He emphasized understanding the businesses one invested in thoroughly.

  1. Margin of Safety:

  • Inspired by Benjamin Graham, Munger suggested buying investments at a good discount. This provided a safety net against unexpected risks.

  1. Constructive Pessimism:

  • Munger advised being a "constructive pessimist." While it was good to be hopeful about the future, he believed it was equally crucial to carefully consider potential risks and downsides.

In simple terms, Munger's approach to investing involved always learning, sticking to what you know, thinking about problems from different angles, and being patient and ethical in your decisions. He believed in being well-prepared and having a safety cushion in your investments.


Friday, August 11, 2023

NEPSE, Development Bank, Finance, Hydropower & Life Insurance weekly scenario 8/11/2023 !!


The recent weekly scenario has been characterized by a trading range between 1806.95 and 2224.48. This range-bound market suggests that the market has been moving within a specific price range without a clear trend in either direction. For market participants, making informed decisions in such a scenario typically requires identifying potential breakout points. One interesting technical indicator that has emerged is the "hammer" candlestick pattern, particularly in the context of the weekly timeframe. The significance of this pattern increases with higher timeframes, as it suggests stronger potential reversal signals. 

The hammer candlestick pattern itself is recognized as a potential reversal signal in technical analysis. It is characterized by a small-bodied candle with a long lower shadow, resembling a hammer. This pattern often indicates a shift from a downtrend to a potential uptrend, suggesting a potential bullish reversal. Given the higher timeframe, the hammer pattern becomes more reliable as it reflects a longer accumulation of market sentiment and information. 

One crucial aspect that traders and investors often consider is the risk-to-reward ratio when making trading decisions. In this case, the risk-to-reward ratio stands at an appealing 1:2.41, indicating that the potential reward is more than double the potential risk. This is generally considered a favorable risk-to-reward ratio, as it implies that the potential gain outweighs the potential loss. 

Taking all these factors into consideration, a potential trading strategy could be to buy at the current market price, with a well-defined stop loss set just below the hammer pattern. This stop loss serves as a safety net in case the market does not follow the anticipated bullish reversal, limiting potential losses. The target price for this trade could be set at 2244.48, which aligns with the upper boundary of the recent trading range. This approach combines the potential bullish indication from the hammer candlestick  pattern, the higher timeframe reliability, and the attractive risk-to-reward ratio. 

However, it's important to note that all trading decisions carry inherent risks. Market conditions can change rapidly, and unforeseen events can impact stock prices. Traders and investors should conduct thorough research, consider their risk tolerance, and potentially consult with financial professionals before executing any trades.


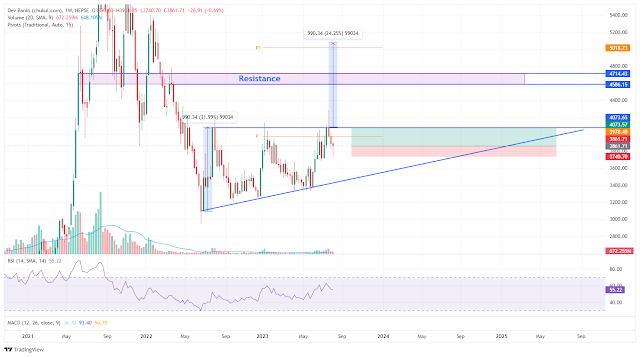
Development Bank weekly scenario.


A notable technical scenario has emerged on the weekly timeframe. An ascending triangle pattern is forming, and as is often the case, its significance tends to increase with higher timeframes. This pattern, marked by higher lows and a consistent resistance level, suggests the potential for an upward price movement. Adding to this is the appearance of a "hammer" candlestick pattern on the same weekly timeframe.

Traders have two strategic options in the current situation. One is to engage in the market now, following the hammer candlestick pattern’s potential reversal signal. With a risk-to-reward ratio of 1:1.75, a trade can be executed with a stop loss below the hammer and a target price of 4073.57.

The alternative approach is to wait for confirmation through the breakout of the ascending triangle pattern. Traders could also consider entering near the triangle's trend line, enhancing the trade's likelihood of success.

Finance weekly Scenario. 


A symmetrical triangle pattern, notable for its converging trend lines, is unfolding. Such patterns carry increased significance on higher timeframes, often indicating an impending significant price movement.

Adding to this, the observation of a "hammer" candlestick pattern on the same weekly timeframe elevates the intrigue.

Traders have a strategic option at hand: buying at the present market price, with a stop loss strategically positioned below the hammer candlestick pattern. The target range spans from 1956.41 to 1989.99, offering a clear goal for potential profits.

Notably, the risk-to-reward ratio stands at an attractive 1:2.55, implying the potential reward substantially outweighs the risk.


Hydropower weekly scenario. 


A "hammer" candlestick pattern has emerged within a minor support area, hinting at a potential bullish reversal.

For traders seeking strategic opportunities, buying at the current market price is an option, with a stop loss placed below the hammer pattern. This mitigates risk while aiming for a target around 2551.46, promising an attractive potential gain.

The risk-to-reward ratio is notably favorable at 1:3.24, indicating that potential rewards significantly outweigh potential risks.

Life Insurance weekly scenario. 


A distinctive "hammer" candlestick pattern has emerged within a minor support area, suggesting the potential for a bullish reversal.

For traders considering strategic moves, the current scenario presents an opportunity. The approach involves buying at the current market price, accompanied by a well-placed stop loss just below the hammer candlestick pattern. This serves as a precaution against potential losses if market conditions deviate from the anticipated trend. The target price for this trade is set around 12509.75, offering an attractive potential for profit.

The risk-to-reward ratio in this situation stands at a favorable 1:2.54, implying that potential rewards surpass potential risks – a prudent consideration in trading decisions.

However, it's vital to acknowledge the inherent uncertainties of trading. Rapid market shifts and external influences on stock prices must be considered. Thorough research, self-assessment of risk tolerance, and possibly seeking expert advice are prudent steps before executing trades. Whether seizing current dynamics or awaiting further confirmation, a balanced and informed approach remains key in successful stock trading.

Wednesday, August 2, 2023

Nepse Aug 2

Before the monetary policy announcement by the Nepal Rastra Bank (NRB), the share market was experiencing a healthy and steady growth, with stock prices increasing at a good pace. Investors and traders were optimistic about the market's performance and had positioned themselves accordingly.

However, the sentiment changed dramatically when the NRB declared a monetary policy which did not meet investors and traders’ expectation. As a result, the market experienced a significant fall, erasing much of the previous gains.

During this period, the market witnessed a false breakout at the 2200 level. A false breakout occurs when a stock or market index temporarily moves above a key resistance level (in this case, 2200) but fails to sustain that upward momentum, leading to a sharp reversal. Many traders who had entered the market during this breakout found themselves trapped at higher price levels as the market turned against them.

Amidst the bearish trend, the market eventually formed a hammer candlestick pattern today near a crucial support area. A hammer candlestick is a single candlestick pattern with a small body and a long lower shadow, resembling a hammer. This pattern suggests that sellers drove the price lower during the trading session, but buyers managed to push the price back up, indicating potential bullish reversal signals.

Additionally, technical analysis revealed the presence of hidden bullish divergence. Divergence occurs when the price of an asset moves in the opposite direction of a technical indicator, indicating a potential shift in the underlying trend. Hidden bullish divergence suggests that even though the market's price was making higher lows, the indicator was making lower lows, implying underlying strength and a possible reversal to the upside.

The combination of the hammer candlestick pattern near a critical support level and the presence of hidden bullish divergence can attract traders who are looking for potential opportunities to enter the market. These technical signals may indicate that the market has found support and could potentially reverse its downtrend and move upwards.

However, it's essential to approach such situations with caution, as market sentiment and fundamentals can still have a significant impact on price movements. Traders and investors should consider various factors, including the broader economic conditions, geopolitical events, and the NRB's future policy actions, to make informed decisions.

In conclusion, the subsequent formation of a hammer candlestick pattern with hidden bullish divergence near support can be seen as potential signals for traders to consider when evaluating market entry points. Nonetheless, proper risk management and thorough analysis remain essential in navigating the share market's volatile environment.


Saturday, July 22, 2023

NEPSE Current Scenario


As of the current situation, NEPSE (Nepal Stock Exchange) is currently approaching a resistance area, which is a price level that has been tested multiple times in the past around 2200. This area has acted as a strong barrier in the past, causing the market's upward movement to stall or face selling pressure.

When a price level is tested multiple times without being breached, it is believed to weaken, as traders and investors take notice of this level and may adjust their positions accordingly. As a result, some traders who had bought at lower levels might start closing their positions to secure their profits, leading to a reduction in selling pressure.

The weakening of the resistance area at 2200 presents the possibility of a potential breakout. A breakout occurs when the price successfully and decisively moves above the resistance level. Such breakouts are often viewed as opportunities for profitable entry positions, as they indicate a potential continuation of the upward trend.

However, it's important to note that breakouts are not guaranteed, and trading in financial markets carries inherent risks. Traders should exercise caution and consider various factors beyond technical analysis, including overall market conditions, trading volume, economic indicators, and other fundamental aspects.

As the price approaches the key level of 2200, traders may consider positioning themselves for a potential breakout by entering long positions (buying). Nevertheless, it's prudent for traders to wait for confirmation of the breakout, such as sustained price movement above 2200, to reduce the risks associated with false breakouts or sudden reversals.

In summary, the current NEPSE scenario indicates that the market is near a significant resistance area at 2200, which has been tested multiple times and potentially weakened. This presents a higher chance of a breakout occurring, leading traders to consider profit-entry positions with careful consideration of other market factors. As with any trading activity, it's essential to acknowledge the risks involved and seek advice from financial professionals before making investment decisions.

Key points about resistance levels:

1. Repeated testing of a resistance level indicates strong selling interest and makes it a significant turning point for the price.

2. Resistance can weaken over time as traders’ close positions to protect their gains, leading to reduced selling pressure.

3. A weakening resistance level increases the probability of a potential breakout, which is seen as a buying opportunity for traders.

4. Entering long positions near the resistance level is a common entry strategy for traders anticipating a breakout.

Considering various factors and using multiple tools and indicators can help traders make more informed decisions while trading and investing in financial markets.


Sunday, January 15, 2023

NEPSE at Supply Zone


With the market rising steadily from 1849.44 to 2277.35, it gained 23.24% in time span of 15 business days. The market reached a high of 2277.35 on January 10, 2023, and ended at 2190.42, making a bearish candle i.e., shooting star near the supply region where the market turned around on August 1, 2022. Market is in the supply zone right now, and profit booking is evident. We can watch for a reversal pattern (W Pattern) to assume a new position. As a support zone, the Fibonacci levels of 0.5 (2042.02) and 0.618 (1986.60) can be used. 


Shooting Star 

A shooting star candlestick is a bearish candlestick that occurs after an uptrend or in a supply zone and signals a market reversal. A shooting star implies that the market is under intense selling pressure. A candlestick formation must develop during an increase in order to be regarded as a shooting star. Additionally, the gap between the opening price and the highest price of the day must be greater than double the size of the shooting star. Under the genuine body, there shouldn't be little to no shadow. 


INVESTMENT IN STOCK MARKET IS SUBJECT TO RISK.BEFORE TAKING ANY POSITION CONSULT YOUR FINANCIAL ADVISER OR DO YOUR OWN RESRARCH.ANY PROFIT OR LOSSES GENERATED FROM THIS IS SOLELY FROM YOUR DECISION.