Saturday, July 30, 2022
Saturday, July 23, 2022
NEPSE update July 23
NEPSE SCENARIO ON A DAILY BASIS
Scenario 1
Break out of 2065 with above volume average without facing larger selling pressure will trigger a buy call.
Scenario 2
Green candle in the trend line area with the above average volume will trigger a buy call with stop loss below 1908-1900.
INVESTMENT IN STOCK MARKET IS SUBJECT TO RISK.BEFORE TAKING ANY POSITION CONSULT YOUR FINANCIAL ADVISER OR DO YOUR OWN RESEARCH. ANY PROFIT OR LOSSES GENERATED FROM THIS IS SOLELY FROM YOUR DECISION.
NEPSE on dow theory basis
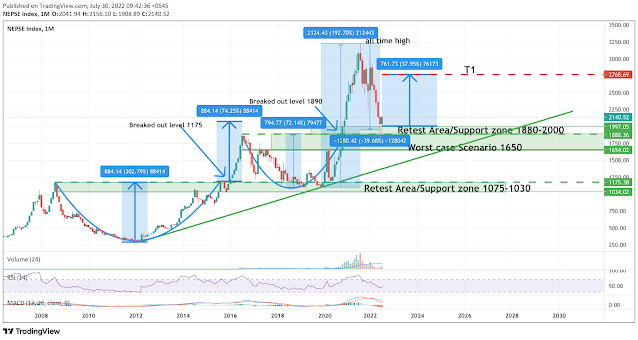
Whenever the market retest on the very first time in the support zone similarly what happened on Feb 2019, there is high probability of market taking a good upside move but that does not mean market must bounce back at that very level. But we can take an entry position with stop loss which is very important thing when we take technical analysis as a tool for trading purpose.
Retest area is 1880 -2000 which is also the psychological level where trades and investors might react.
INVESTMENT IN STOCK MARKET IS SUBJECT TO RISK.BEFORE TAKING ANY POSITION CONSULT YOUR FINANCIAL ADVISER OR DO YOUR OWN RESEARCH. ANY PROFIT OR LOSSES GENERATED FROM THIS IS SOLELY FROM YOUR DECISION.
Subscribe to:
Comments (Atom)
-
In the past five years, the NEPSE index has shown limited growth following monetary policy announcements, with the exception of one fiscal y...
-
As we near the end of the fiscal year 2080/81, it is essential to examine the historical performance of NEPSE during the critical fourth qua...
-
There is big controversy going around that technical analysis doesn't work on NEPSE so here I did some back testing on NEPSE index befor...


